
Picture a management meeting six months after an AI rollout. The owner asks what it has done for the company. The head of sales says, “The team finds it easier.” The CFO shows the margin, and it has barely moved. Nobody can say what the agent delivered, or whether it delivered anything, because nobody wrote down how things stood before launch.
The same question is now being asked about big business as a whole.
What Apollo’s numbers show
On October 24, Apollo’s chief economist Torsten Slok published a note with a blunt conclusion: outside tech, AI has delivered “zero financial payoff” to corporate America. Revenue per worker and profit margins are rising for the seven tech giants and are flat for the other 493 companies in the S&P 500. He sees no signs of AI lifting productivity growth either. In his reading, these companies are starting to treat token spending as a cost that weighs on margins, not a source of growth. TechCrunch covered the note a day later.
Two caveats. This is an average across large US corporations, so it says nothing about any single company, let alone a mid-size distributor in Europe. And it is one economist’s reading. In the Hacker News discussion, one commenter points to electrification: a few industries moved quickly, but the wider benefit took years, because production had to be rebuilt around it first. “AI doesn’t work” does not follow from any of this.
Neither Apollo nor anyone else can tell you what is happening in your company. Only your own baseline can.
Without a baseline, the effect can’t be shown or disproved
A baseline is your process numbers before the agent goes live, written down in advance.
The agent launches in October, and by December margin is up a point. Was it the agent? The season? A supplier changing terms? A new sales manager? If margin falls, the questions are the same. Without the “before” numbers, everyone at the table has their own version, and so does the vendor.
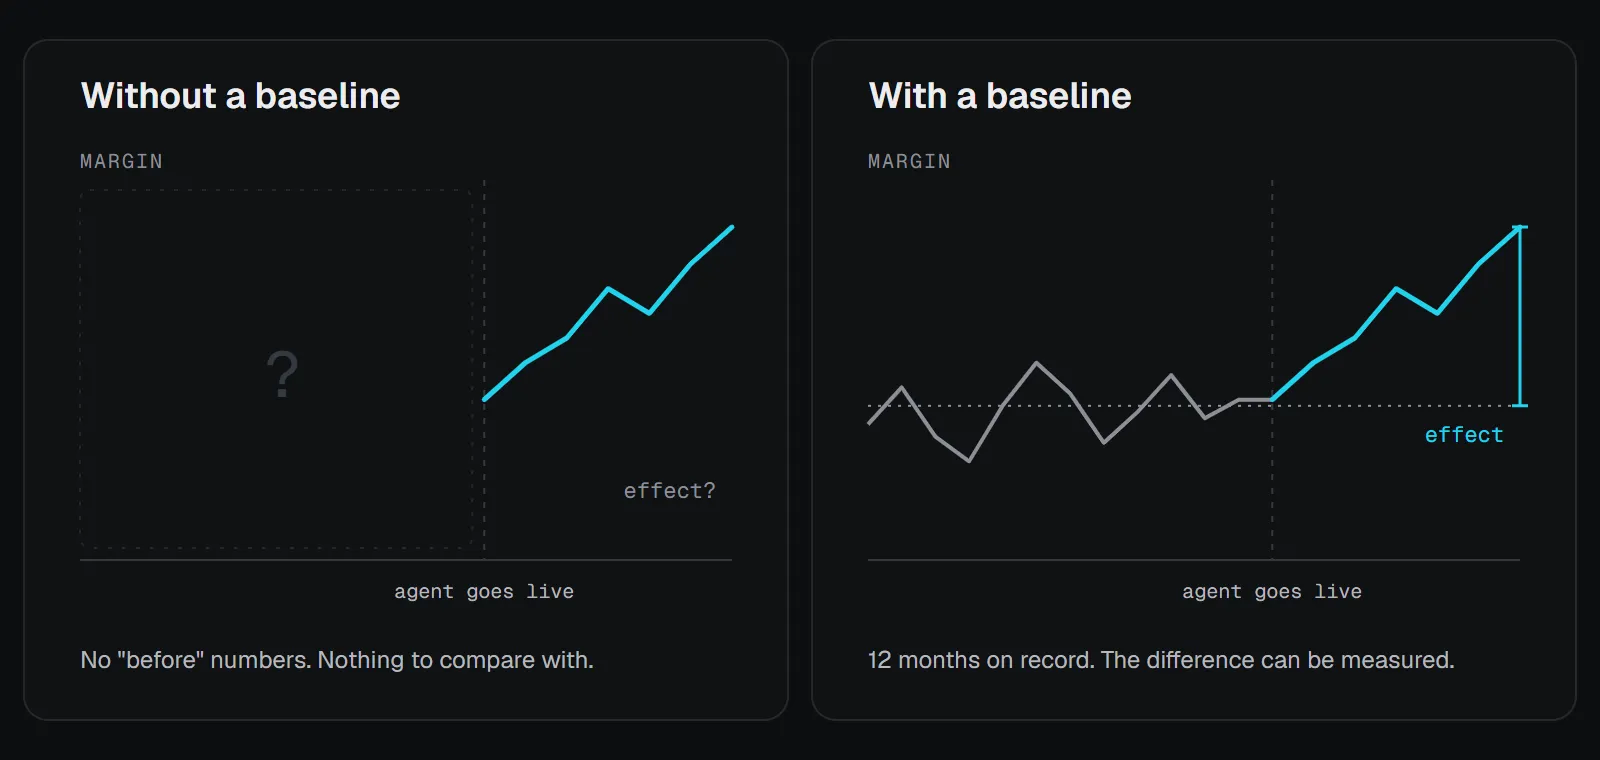
A schematic with no real numbers: it shows the logic of the comparison, not an expected result.
The second trap is hours. “Each sales rep saves an hour a day” sounds like a result. But an hour turns into money only when other work moves into it: more quotes handled, or a hire you didn’t have to make. Otherwise it dissolves into the working day. So we count the effect in margin, not in hours and not in revenue.
What to record before launch
One page per process is enough, for the process you plan to hand to an agent. For example, the path from a customer request to a quote sent.
| What to measure | Where to get it | Why |
|---|---|---|
| Volume: requests, quotes or invoices per month | CRM, ERP | To separate the effect from a change in demand |
| Time: from intake to result | Dates in CRM or email | To see where the process stalls |
| Staff hours on the process | A short one-week measurement | To know what can actually be freed up |
| Result: share that reaches payment | CRM, ERP | To track deals, not activity |
| Margin per deal, after discounts | ERP | To count money, not turnover |
| Rework: errors, returns, repeat quotes | CRM, complaints log | So speed isn’t bought at the cost of quality |
Take 12 months, so the season is visible. HubSpot, Pipedrive, SAP Business One, Dynamics 365 or Odoo exports are enough to start. For each number, write down how you calculate it and who owns it. Otherwise, six months later you’ll be arguing about whose figure is right.
How to calculate the effect later
(extra deals × average deal × margin) + (freed hours that moved to other work × hourly cost) − cost of the agent
An example for a hypothetical distributor, one quarter after launching a quoting agent:
- 6 extra deals × €25,000 × 18% margin = €27,000;
- the agent freed 300 hours, but only 120 actually moved to other work: 120 × €30 = €3,600.
That makes €30,600 of margin per quarter before the cost of the agent: tokens, support and the time people spend checking its work. This is an example with made-up numbers. It shows how to calculate, not what an agent would deliver for you.
Counting all 300 hours would add €5,400 to the report that isn’t in the margin.
Don’t take the extra deals on faith either. Compare with the same quarter last year and, if you can, with sales reps or a product line not yet using the agent. Then the season and shifts in demand show up separately.
When the baseline shows you don’t need AI
Sometimes the answer appears while you are still collecting the numbers. Say a quote takes an hour to put together, then waits two days for discount approval. What you need then is an approval rule and maybe a little plain code. An agent won’t change anything here.
That is a result too: you won’t spend money where it won’t come back.
What to do this week
- Pick the one process you’d hand to an agent first.
- Export its volume, time, result and margin for the last 12 months.
- Write down how each number is calculated and who owns it.
If you can’t collect these numbers in a few days, that is the place to start, before any agent.
In a diagnostic we put a price on each point of loss using your data. You can see what that looks like in the sample diagnostic book. You can start with one free call: message us on WhatsApp, and in 30 minutes we’ll walk through how an order travels from customer request to payment and name 1–2 likely places where money is lost.